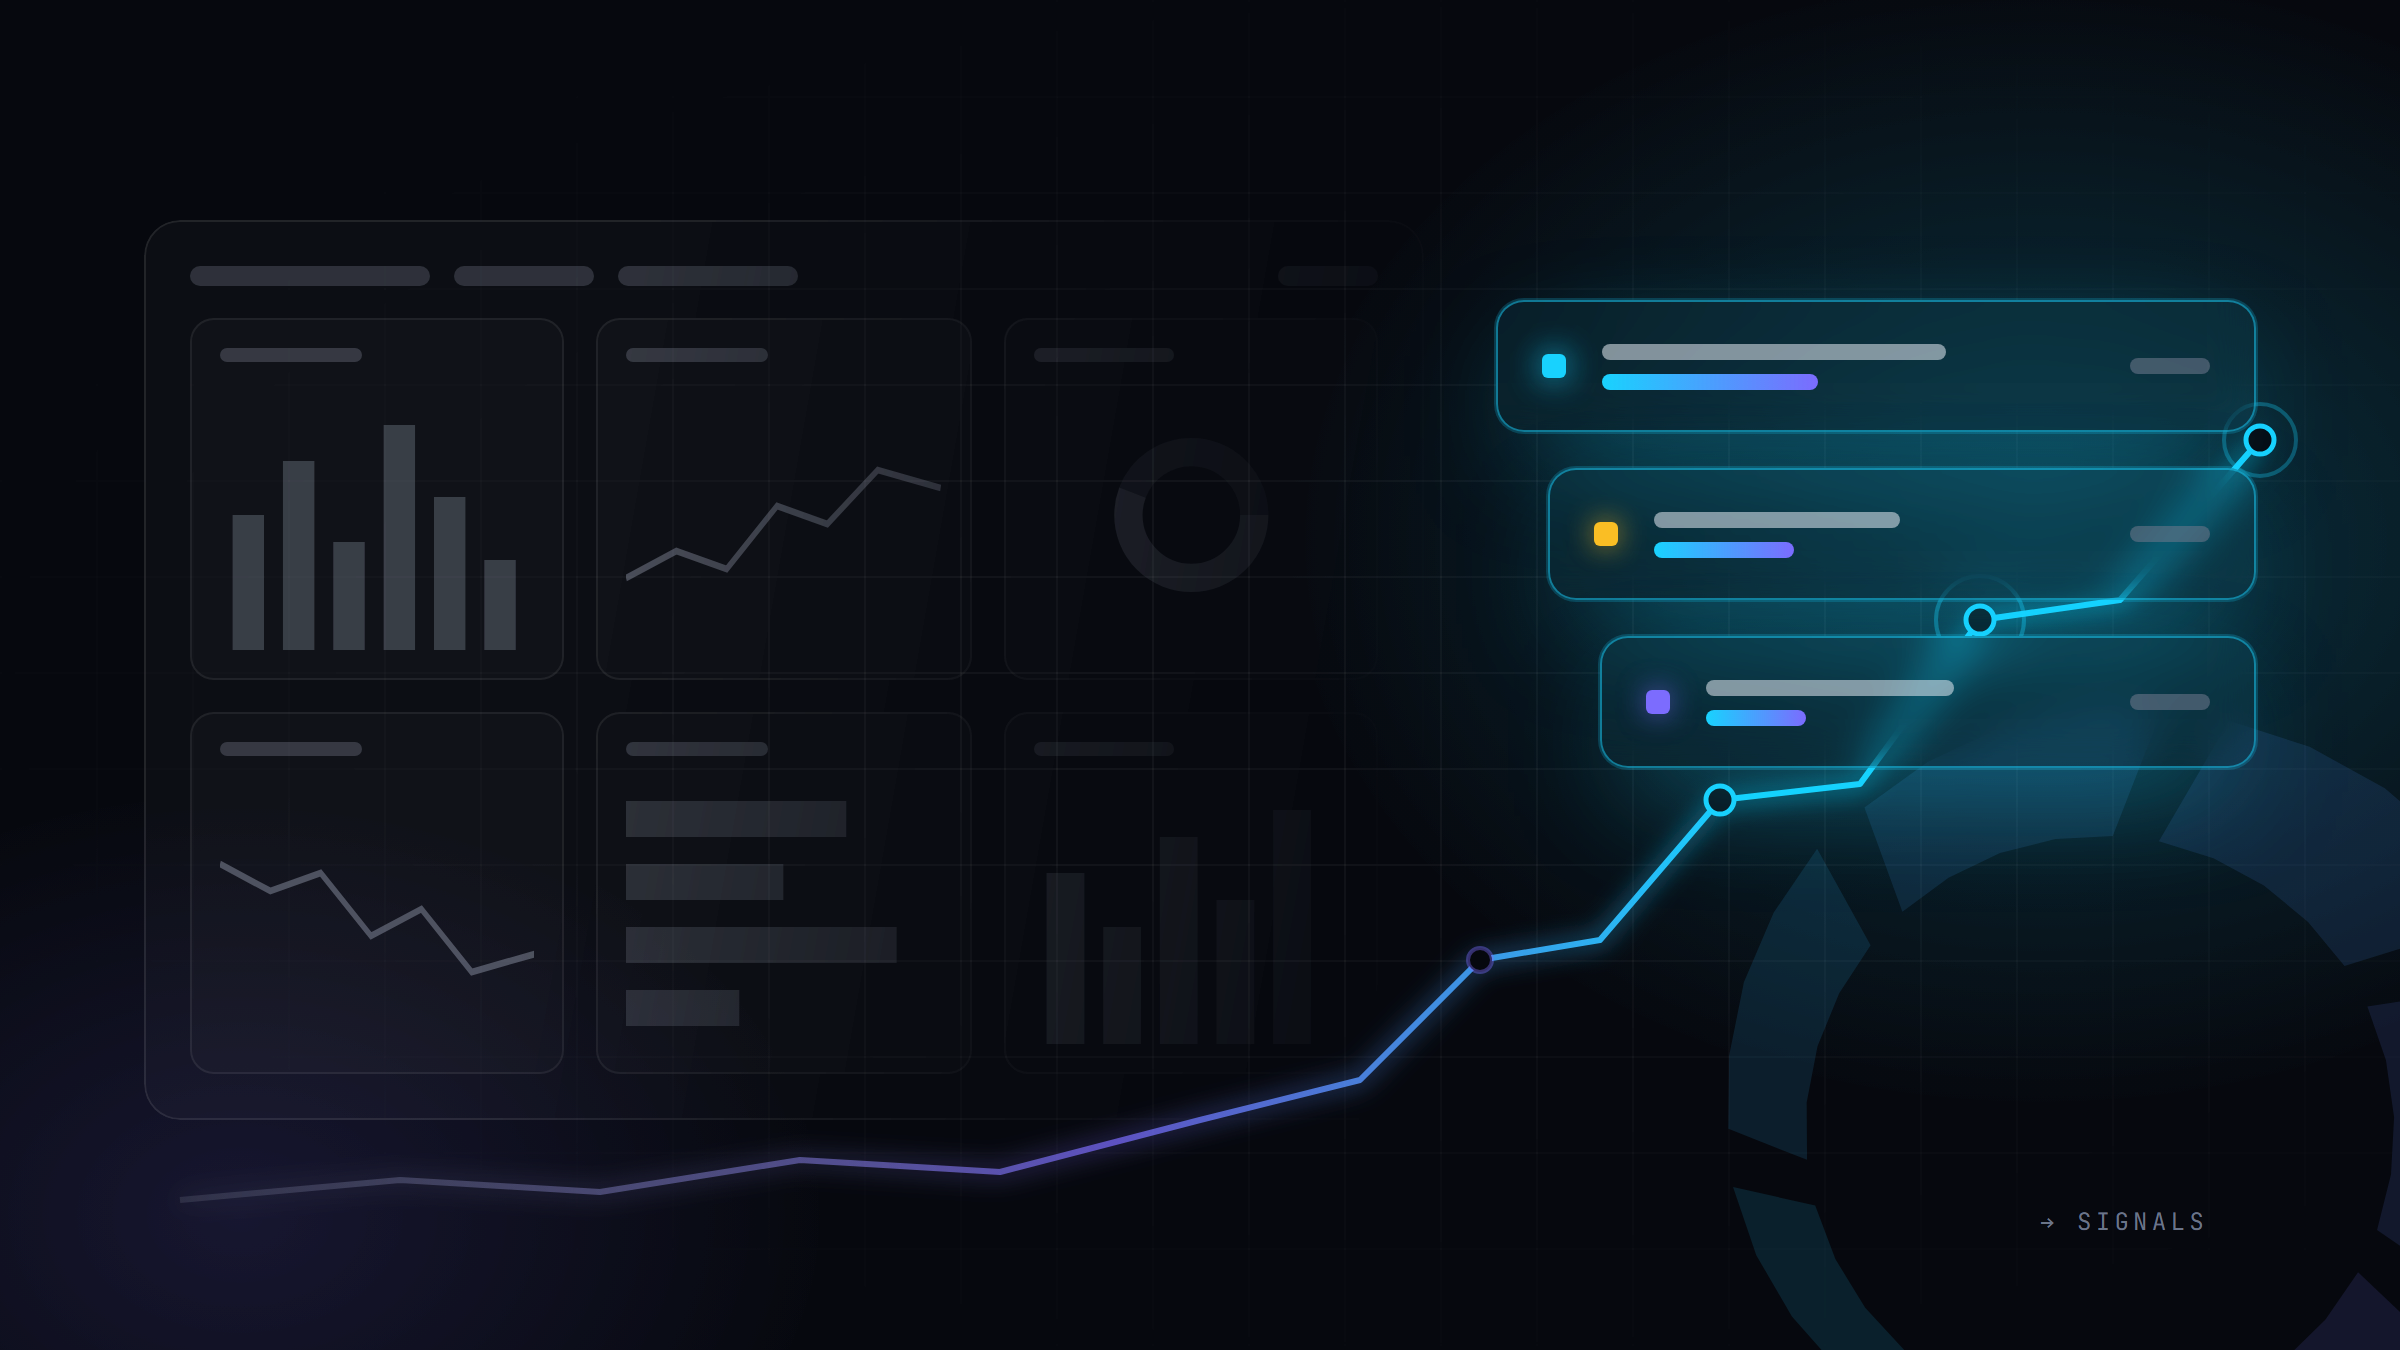
There is a dashboard in almost every company we visit. It was built with care, it looks good, and the login log says the same two people opened it last month. One of them built it.
This is not a story about a bad tool. The pattern repeats with every tool we have seen, from a spreadsheet with charts to the most expensive BI suite. The problem is the shape of the thing.
Why dashboards go unopened
They ask people to go looking. A dashboard is a place. To get anything out of it, the ops manager has to remember it exists, open it, find the right page, read twelve numbers and decide which one matters today. On a day with a supplier problem and two customer calls, that never happens. The dashboard is competing with the inbox, and the inbox wins.
They show everything, so they say nothing. The first version has six KPIs. By the third month it has forty, because every meeting added one. At that point nothing stands out; a number that is going wrong looks exactly like a number that is fine.
Nobody owns the numbers. When a KPI drops, who is supposed to act? If the answer is "whoever notices", nobody notices. We have sat in meetings where two departments argued for twenty minutes about which of two margin figures was right, and the dashboard showed both.
They lag. Data loads once a night, someone checks it once a week, the review happens once a month. By the time a problem is discussed it has cost six weeks.
They were built for the builder. Dashboards are usually designed by the person who knows the data, for an imagined executive who will "explore". Real executives do not explore. They want to know whether something needs their attention and, if not, to get on with their day.
What works instead: signals
The alternative is not a better dashboard. It is to flip the direction. Instead of people going to the data, the data comes to the people, and only when it has something to say.
A signal is one sentence with a number in it, sent to a named person when a defined condition is met. "Gross margin at customer X fell 3.1 points this month; the main driver is SKU family Y." "Stock older than 120 days crossed the limit you set; 60% of it is three product lines." "Four deals above the size you care about have had no activity for three weeks."
Signals have properties a dashboard cannot have:
- They arrive. In the inbox, in Teams, in Slack, wherever the person already lives. There is nothing to remember to open.
- They are silent when nothing happened. No signal is information too: the number is inside its band. This is why they do not get muted, as long as the thresholds are set honestly.
- They name a person. Each signal has an owner who is expected to act or to reply "known, handled".
- They carry a next step. The best signals end with the two or three most likely causes and the action that worked last time.
This is the pattern behind the AI agents we build for operations. In our own track record it reached 100% adoption, with dashboards replaced by proactive signals, and today our agents are serving 30 enterprise clients. The mechanism is the same at 50 people as at 5,000; only the number of signals changes.
KPI ownership: one number, one owner, one definition
Signals only work if the numbers underneath them are trusted, and trust comes from ownership, not from tooling.
For each KPI that matters, write down three things: the definition (what exactly is counted, from which system, with which exclusions), the owner (the one person who answers for it and acts when it moves), and the source (the single table the number comes from, so there is no second version). That is a one-page document per KPI, and it is the most valuable thing most companies produce in a data project. When two numbers disagree, the page settles it in a minute.
A practical limit: a company of 50 to 200 people rarely needs more than ten or twelve KPIs with owners. If the list is longer, some of them are metrics rather than KPIs, and they can live in a report that people open when they need it.
A weekly rhythm
The third piece is the smallest and the most often skipped: a fixed, short, weekly moment where the week's signals are reviewed. Thirty minutes, same slot, the KPI owners in the room or on the call. Three questions per signal: was it right, what did we do, does the threshold need to move.
This does three things. It tunes the system, because thresholds that fire too often or too late get fixed. It makes ownership real, because each person reports on their number in front of the others. And it replaces the monthly review nobody enjoyed with something people actually use, because the content is already in their inbox and the meeting is about decisions.
Where dashboards still belong
None of this means dashboards are useless. They are good for two things: investigation after a signal ("show me this customer's margin by SKU for the last twelve months"), and the few roles that genuinely monitor all day, like a dispatcher or a trading desk. Build those, keep them small, and let them be opened when they are needed rather than judged by how often they are opened.
If you have one of these dashboards
Pick the three numbers on it that someone would act on the same day if they moved. Write the definition and the owner for each. Turn them into signals that arrive, with a threshold you are willing to defend. Run the weekly review for six weeks. Then look at the dashboard login log again.
If you would like a second opinion on which three numbers those should be, we are glad to look at it with you in a 30-minute call.